This paper is available on arxiv under CC 4.0 license.
Authors:
(1) Ulysse Gazin, Universit´e Paris Cit´e and Sorbonne Universit´e, CNRS, Laboratoire de Probabilit´es, Statistique et Mod´elisation,
(2) Gilles Blanchard, Universit´e Paris Saclay, Institut Math´ematique d’Orsay,
(3) Etienne Roquain, Sorbonne Universit´e and Universit´e Paris Cit´e, CNRS, Laboratoire de Probabilit´es, Statistique et Mod´elisation.
Table of Links
- Abstract & Introduction
- Main results
- Application to prediction intervals
- Application to novelty detection
- Conclusion, Acknowledgements and References
- Appendix A: Exact formulas for Pn,m
- Appendix B: Numerical bounds and templates
- Appendix C: Proof
- Appendix D: Explicit control of (16) for α=0
- Appendix E: Proof of Corollary 4.1
- Appendix F: The Simes inequality
- Appendix G: Uniform FDP bound for AdaDetect
- Appendix H: Additional experiments
H Additional experiments
In this section, we provide experiments to illustrate the FDP confidence bounds for AdaDetect, as mentioned in Remark 4.2 and Section G.
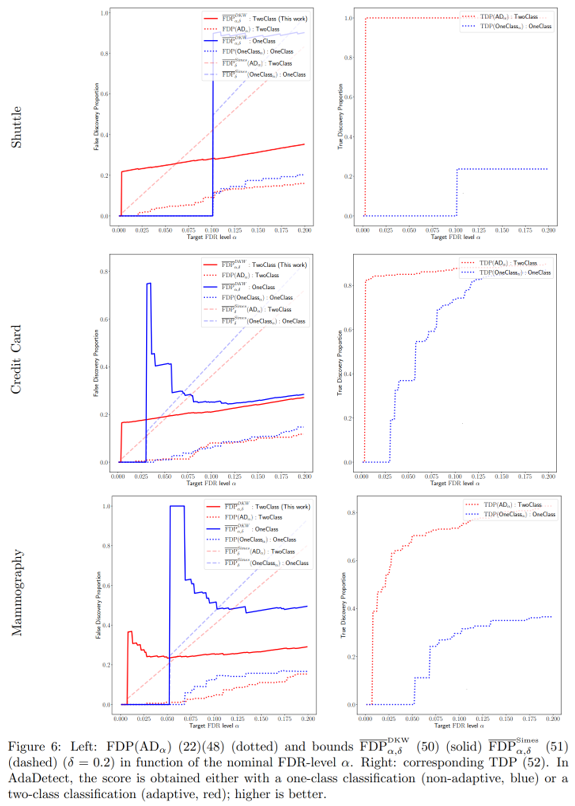
The two procedures used are of the AdaDetect type (48) but with two different score functions: the Random Forest classifier from Marandon et al. (2022) (adaptive score), and the one class classifier Isolation Forest as in Bates et al., 2023 (non adaptive score). The hyperparameters of these two machine learning algorithms are those given by Marandon (2022).
The FDP and the corresponding bounds are computed for the two procedures. The true discovery proportion is defined by

Following the numerical experiments of Marandon et al. (2022) and Bates et al. (2023), we consider the three different real data from OpenML dataset (Vanschoren et al., 2013) given in Table 1.
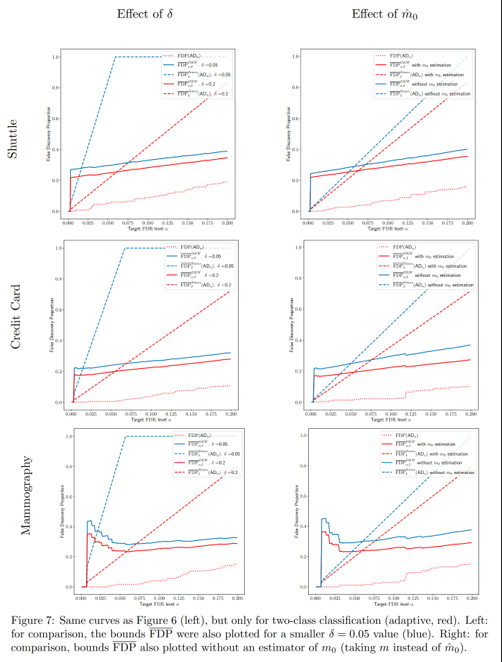
The results are displayed in Figure 6 for comparison of adaptive versus non-adaptive scores for the different FDP confidence bounds and the TDP. On Figure 7, we focus on the adaptive scores and corresponding FDP bounds only; we compare the effect (on the bounds) of demanding a more conservative error guarantee (δ = 0.05 versus δ = 0.2), as well as the effect of estimating m0 via (25) instead of just using the inequality (24) with ˆm0 = m.
The high-level conclusions are the following:
Table 1: Summary of datasets.

• using adaptive scores rather that non-adaptive ones results in a performance improvement (better true discovery proportion for the same target FDR level)

• estimating the estimator ˆm0 from (25) yields sharper bounds on the FDP and is therefore advantageous.


